🤔 Terminal Command History Analysis
··2 mins
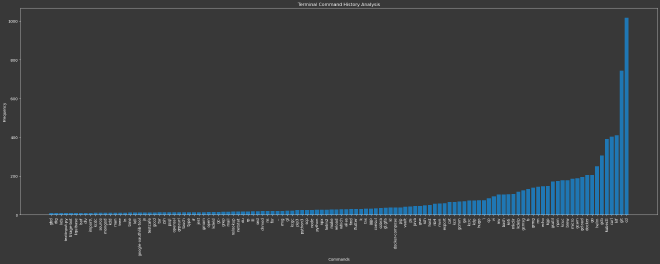
I was curious to see what my most used commands were, so put together a small notebook to run a quick analysis.
Download the notebook here.
Suggested setup and usage:
- Install anaconda
- Create a jupyter folder (maybe in the home folder
~/) and another folder for this notebook (maybe namedcommand-analysis)mkdir -p ~/jupyter/command-analysis - Copy the this file into that folder
cp ~/Downloads/terminal-command-history-analysis.ipynb ~/jupyter/command-analysis - Get your history file ready (without line numbers)
history | cut -c 8- > ~/jupyter/command-analysis/history.txt - Run
jupyter notebook - In your browser open jupyter http://localhost:8888/
- Run the rest of this notebook
command_frequency_map = {}

with open('./history.txt') as f:
    lines = [line.strip() for line in f]

for line in lines:
    command_end = len(line)

    try:
        if line.index(" "):
            command_end = line.index(" ")
    except:
        pass

    try:
        if line.find("sudo") > -1:
            command_end += line[command_end + 1:].index(" ") + 1
    except:
        pass

    line = line[:command_end]

    if line in command_frequency_map:
        command_frequency_map[line] += 1
    else:
        command_frequency_map[line] = 1

count_to_show = 9
# only show items with a frequency higher than count_to_show
items = {k:v for k,v in command_frequency_map.items() if v >= count_to_show}

print(items)
import matplotlib.pyplot as plt
import numpy as np
%matplotlib inline

# sort items with highest frequency on right
items = {k: v for k, v in sorted(items.items(), key=lambda item: item[1])}

# adjust colors of chart
plt.rcParams.update({
    "text.color": "white",
    "xtick.color": "white",
    "ytick.color": "white",
    "axes.edgecolor": "white",
    "axes.labelcolor": "white",
    "axes.facecolor": "#383838",
    "figure.facecolor": "#383838",
    "figure.edgecolor": "#383838",
    "savefig.facecolor": "#383838",
    "savefig.edgecolor": "#383838"})

# adjust size / resolution of chart
plt.rcParams['figure.figsize'] = [30, 10]
plt.rcParams['figure.dpi'] = 100

# set chart values
plt.bar(range(len(items)), list(items.values()), align='center')
plt.xticks(range(len(items)), list(items.keys()))
plt.xticks(rotation = 90)

# set chart labels / title
plt.xlabel("Commands")
plt.ylabel("Frequency")
plt.title("Terminal Command History Analysis")

plt.show()

Seems about right. My top activities in terminal seems to be:
- changing directories
- creating / changing branches and commiting
- tracing logs in a kubernetes pod
- testing APIs with curl